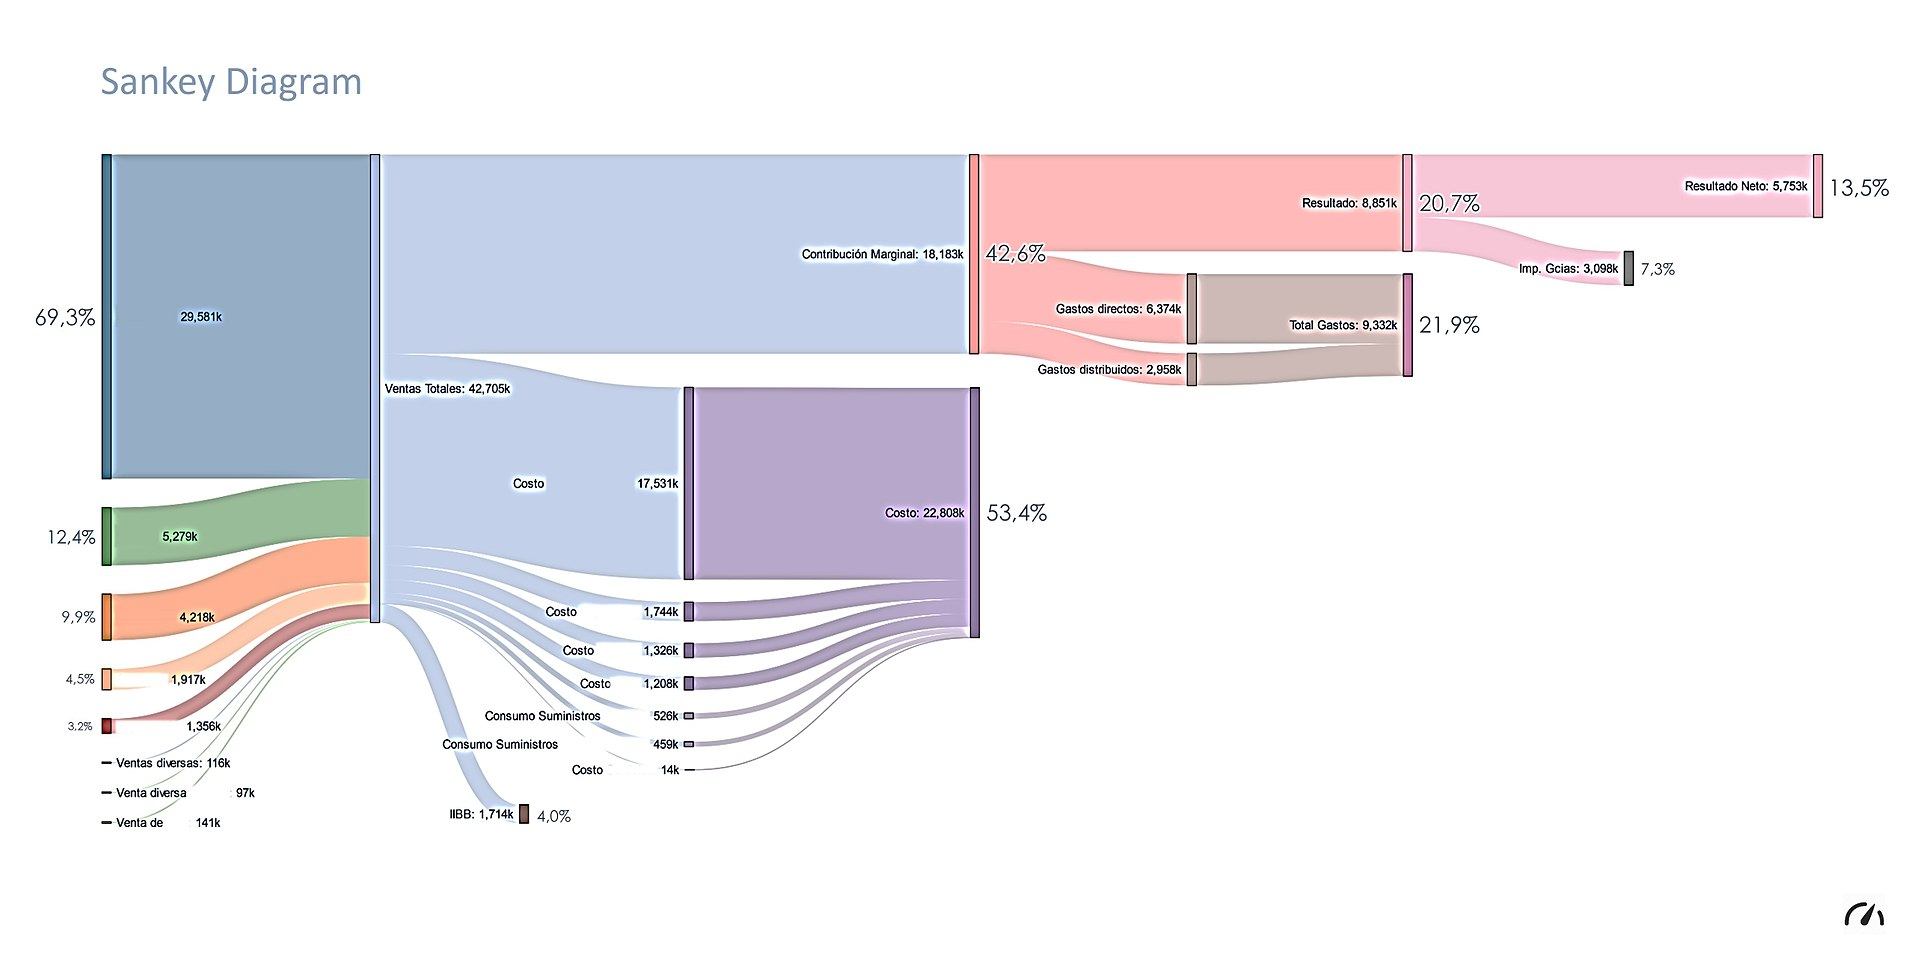
Sankey Diagram are used to show Stocks and Flows within a System across different states. For example:
There is a site dedicated to examples.
SankeyMatic is a useful webapp for building Sankey diagrams built atop the D3 javascript library. Google charts has a sankey diagram